
ISSN 2410-5708 / e-ISSN 2313-7215
Year 9 | No. 26 | p. 163 - 182 | October 2020 - January 2021
© Copyright (2020). National Autonomous University of Nicaragua, Managua.
This document is under a Creative Commons
Attribution-NonCommercial-NoDerivs 4.0 International licence.

Healthy lifestyles and their association with personal factors in UNAN–Managua students 2017.
https://doi.org/10.5377/torreon.v9i26.10256
Submitted on March 13, 2020 / Accepted on July 6, 2020
Ph.D Jairo Vanegas López
Faculty of Medical Sciences, Santiago de Chile
University of Santiago, Chile
Section: Education
SCIENTIFIC ARTICLES
Keywords: lifestyles, students, personal factors, university.
Abstract
Objective: To determine whether there is an association between lifestyles and personal factors in UNAN-MANAGUA university students.
Methodology: A sample of 753 university students from 16 to 29 years of first to fifth year of 2012-2016 was analyzed. An analytical design with statistical methods of chi square association testing was used to determine the association of variables and logistic regression analysis to determine the strength of association using the Odds Ratios (OR) of the risk factors and to know the predictive value of each of the dimensions of the lifestyles.
Results: The average age of female students is 19 and for the male is 20 years, the body mass index of the students is overweight, the male in obesity grade 1. 74% of students in the urban area, 52.5% of students in study do not have any type of student scholarship, 90% of students do not report self-informed illness, and 60% of students of both sexes have inadequate lifestyles. No difference was found in the lifestyle according to sex. Bivariate analysis does not reflect statistical association (p-value greater than 0.05) between the variables age, sex, body mass index, provenance, height and lifestyle. In the logistic regression analysis the most significant covariates found in the model were nutrition, exercise, health responsibility, stress management, self-realization and student lifestyle.
Conclusion: Most students have inadequate lifestyles. The personal factors age, sex, body mass index, provenance and height of students are not associated with the lifestyle of these. On the other hand, there is a strong association between the dimensions of nutrition, exercise, responsibility in health, stress management, self-realization and student lifestyle.
Introduction
According to the World Health Organization (WHO, 1986) lifestyle is defined as a general way of life that is based on the mutual influence of personal, social and cultural factors. In this sense lifestyles refer to the way of life of people, a concept that is closely related to motivational and behavioral components, and which is influenced by customs, habits, fashions and values that exist in a certain moment and context, factors that are learned and, therefore, modifiable during the course of life (Cala M. L., 2010).
In this way, lifestyles are structured with the contributions of the different social contexts in which is developed the daily life such as family, school, friends, the media, the church, among others. As a result, these factors influence the choices young people make about their lives. (García V. E., Salazar Arango, Docal Millán, Aya Gómez, & Ardila Chacón, 2014).
Similar studies have made it clear that these factors have an impact on lifestyle formation in young students. For example, in Spain, Peru and El Salvador these factors were studied in aspects of lifestyle such as initiation of sexual activity, use of toxic substances, use of free time and interpersonal relationships (García V. E., Salazar Arango, Docal Millán, Aya Gómez, & Ardila Chacón, 2014).
Nationally, studies have shown the prevalence of risk factors in young university students as a result of lifestyles such as: risks of Chronic Noncommunicable Diseases (NTSCs), tobacco use, alcohol among young people without distinction of social class, with a growing tendency to be adopted by young women.
The initiative of this study arose in the because of the need to recognize two situations; first, that adolescence is a decisive stage in the acquisition and consolidation of lifestyles. In this period, young people face new responsibilities in the process of acquiring autonomy by practicing values, imaginary relationship models and the cultural heritage learned throughout life, while incorporating new elements from the contexts of influence, (Rodrigo, and others, 2004).
Secondly, the accelerated changes they go through in their physical, emotional and social development can give them ambivalences and contradictions in the process of finding balance with themselves and with society, so they need to develop capacities that enable them to be responsible adults in their duties and rights, (Acute, 2014).
Material and method
It is a cross-sectional and analytical study whose universe was constituted by all undergraduate students of the university, between 16 and 29 years, enrolled in 2016, who entered in 2012 and to date represented N = 17,982 students.
A stratified sample with optimal proportional sharpening was calculated. This sample was distributed according to the weight of each stratum corresponding to faculties, being the sample size of 753 students. The selection of the sample was random, by major and year of entry in such a way that the representativeness of the entire universe was ensured.
The study’s ethical considerations were informed consent, the participant was given the opportunity to ask questions and was encouraged to do so, and the researcher respected the integrity of the participant. Moreover, the results of the research will not be used for purposes other than to identify the lifestyle of the students of the Rubén Darío University Campus (RURD) 2017, no data is collected without the prior authorization.
The data was analyzed using the Statistical System (SAS) program. Chi Square Association Tests were conducted to determine the association of variables and logistic regression analysis to determine the strength of association using the risk factors ORs and to understand the predictive value of each of the lifestyle dimensions.
Results
Table 1. Personal characteristics per sex. RURD UNAN- Managua 2017 students.
|
Sex |
|||
|
Female |
Male |
||
|
Age in years |
Mínimum |
14 |
16 |
|
Mean |
19 |
20 |
|
|
Maximum |
29 |
29 |
|
|
Standard Deviation |
3 |
3 |
|
|
Current weight in Kilos |
Mínimum |
40.00 |
45 |
|
Mean |
58.14 |
67.26 |
|
|
Maximum |
100.00 |
136.81 |
|
|
Standard Deviation |
9.69 |
13.45 |
|
|
Height in meters |
Mínimum |
1.10 |
1.00 |
|
Mean |
1.58 |
1.69 |
|
|
Maximum |
1.90 |
2.23 |
|
|
Standard Deviation |
.10 |
.12 |
|
|
Body Mass Index |
Mínimum |
15.61 |
14.69 |
|
Mean |
23.43 |
23.74 |
|
|
Maximum |
42.1 |
54.28 |
|
|
Standard Deviation |
4.09 |
4.84 |
|
Source: Students survey
In Table 1 the personal characteristics of students in study can be seen, we see for example, that the average age of those of female students is 19 and for the male sex is 20 years; in both the standard deviation (SD) is 3, indicating that 68.27% of the female sex is entered younger than the male sex. As for weight, there is a clearly difference, because men’s weights are higher than those of women. Women’s weights were between 40 to 100 kg. The average weight was 58.14 ± 9.69 DE, indicating that 68.27% of the weights are grouped between 48.45 and 67.83 kg. Men’s weights were higher between 45 and 136.81 kg, indicating a difference in averages of 9.13 kg from the average weight of women. The average weight of men was 67.26 ± 13.68 DE reflecting that 68.27% of men’s weights are grouped between 53.81 to 80.73 kg. In height it reflects that both males and women have a short height. The height in the women was between 1.10 to 1.90 meters. The average height was 1.58 ± .010 SD, indicating that 68.27% of the heights are grouped between 1.48 and 1.68 meters. As for males the height is between 1.00 and 1.69 meters, the average height of males was 1.69 ± 0.12 DE indicating that 68.27% of the height in meters of males are grouped into 1.57 and 1.81 meters in height. As for the body mass index in women it was between 15.61 and 42.1kg, with an average of 23.43 ± 4.09 SD so it can be inferred that 67.27% body mass index (BMI) is grouped between 19.34 and 27.52 being overweight. In relation to the BMI of males under study were between 14.69 and 54.28 kg, with an average of 23.74 ± 5.27 DE, so 68.27% of BMI are grouped between 18.47 and 29.01 Kg considering obesity grade 1.
The lifestyle with respect to the sex of the students surveyed in the RURD, we find that 55.64% (419) of the respondents belong to the female sex and of these 34.5% (260) presents an inadequate lifestyle.
Table 2. Lifestyle regarding to student gender. RURD UNAN- Managua 2017
|
Lifestyle regarding to student gender |
|||
|
Gender |
Lifestyle |
Total |
|
|
Adequate |
Non-adequate |
||
|
Female |
159 (21.11%) |
260 (34.5%) |
419 (55.64%) |
|
Male |
143 (18.99%) |
191 (25.36%) |
334 (44.35%) |
|
Total |
302 (40.10%) |
451 (59.86%) |
753 (100%) |
Source: Students survey
With regard to lifestyle and provenance, 59% of respondents for 332 students in the urban area have an inadequate lifestyle, so it can be observed that of 119 students in the rural area representing 61% have an inadequate lifestyle.
Table 3. Lifestyle with regard to origin. RURD UNAN- Managua 2017
|
Lifestyle with regard to origin |
|||
|
Lifestyle |
Total |
||
|
Geographical Origin |
Adequate |
Non-adequate |
|
|
Urban |
226 (41%) |
332 (59%) |
558 (100%) |
|
Rural |
76 (39%) |
119 (61%) |
195 (100%) |
Source: Students survey
In relation to self-informed illness and lifestyle, it is appreciated that 60% of university students surveyed for a total of 404 who do not have self-informed illness but have an inadequate lifestyle.
Table 4. Lifestyle and self-informed illness. RURD UNAN – Managua 2017
|
Lifestyle and self-informed illness |
|||
|
Lifestyle |
Total |
||
|
Self-informed illness |
Adequate |
Non-adequate |
|
|
Yes |
32 (41%) |
47 59% |
(79) 100% |
|
No |
270 (40%) |
404 (60%) |
(674) 100% |
Source: Students survey
Table 5. Tests of association, Pearson Chi-squares on lifestyle and personal factors. RURD UNAN- Managua students.
|
Variables |
Chi-Square Pearson Correlation |
gl |
P-Value |
|
Gender |
1.833 |
1 |
0.176 |
|
Provenance |
0.14 |
1 |
0.708 |
|
Self-informed illness |
0.006 |
1 |
0.939 |
Source. Students survey
As it can seen in the lifestyle association test and personal factor variables: gender, provenance and self-informed illness of RURD students, these reflect that the P value is greater than the significance value 0.05 so it can be said that the variables presented in the table are not dependent on the lifestyle of students.
As for BMI as a personal variable of the students surveyed, we find that 93% of respondents have inadequate health responsibility even if 61% have an adequate BMI, this does not mean that in the near future they will continue to retain it. It should be considered that health responsibility includes self-observation behaviors, information and education about health, exercise timely use of health services and informed consumerism when applying for professional assistance.
Table 6. IMC regarding to health responsability. RURD UNAN- Managua students.
|
IMC regarding to health responsability |
|||
|
Categories |
Adequate |
Non-adequate |
Total |
|
Low weight |
1% |
8% |
9% |
|
Adequate |
4% |
61% |
65% |
|
Over weight |
2% |
18% |
19% |
|
Obesity level 1 |
0% |
4% |
4% |
|
Obesity level 2 |
0% |
2% |
2% |
|
Total |
7% |
93% |
100% |
Source: Students survey.
The BMI’s association test with respect to health responsibility as a lifestyle dimension shows a higher P value than significance, so it can be concluded that there is no dependence between BMI and health responsibility.
Table 7. Tests of association Pearson Chi-square on IMC regarding to health responsability of RURD UNAN- Managua students.
|
IMC regarding to health responsability |
||
|
Tests of association Pearson Chi-square |
||
|
Chi-square test |
Freedom levels |
P value |
|
2.809 |
1 |
0.729 |
Source: Students survey.
To perform the multivariate analysis in this study the logistic regression model was used, the model reveals the probability of occurrence of a RURD student possessing an inadequate lifestyle by meeting certain characteristics, these traits we know them through the personal factors of each of the students and the explanatory variables involved in the lifestyle, defined in the University Students Lifestyle Questionnaire (EVEU).
A first logistic regression model was created consisting of variables of personal factors including age, gender, provenance, self-informed disease, child tenure, and BMI, as well as the dimensions of lifestyles: nutrition, exercise, health responsibility, stress management, interpersonal support, self-realization and self esteem. To explain the model we will do so by taking as reference the P value of the Wald statistic that indicates whether the explanatory variables included in the model provide information to explain the model-dependent variable, in our case the lifestyle.
As can be seen in Table 8, the Wald’s P statistic value of genders, age, provenance, self-reported disease, child tenure, BMI and self-esteem have an associated P value greater than 0.05, therefore we say that the variables of personal factors do not provide information to the logistic regression model to predict the lifestyle of RURD students.
Table 8. Logistic regression model of students RURD UNAN-Managua 2017
|
Variables in the equation |
||||||
|
Variables in the equation |
B |
Estándar error |
Wald |
gl |
Sig. |
OR |
|
Gender |
-.138 |
.256 |
.293 |
1 |
.588 |
.871 |
|
Age |
-.023 |
.055 |
.179 |
1 |
.672 |
.977 |
|
IMC_Dummy |
-.182 |
.297 |
.378 |
1 |
.539 |
.833 |
|
Nutrition |
2.441 |
.285 |
73.253 |
1 |
.0001 |
11.482 |
|
Work out |
2.143 |
.419 |
26.178 |
1 |
.0001 |
8.526 |
|
Health responsability |
4.472 |
1.091 |
16.817 |
1 |
.0001 |
87.550 |
|
Stress management |
2.596 |
.356 |
53.192 |
1 |
.0001 |
13.412 |
|
Interpersonal support |
2.643 |
.374 |
50.050 |
1 |
.0001 |
14.058 |
|
Self-updating |
4.072 |
.720 |
31.988 |
1 |
.0001 |
58.694 |
|
Self esteem_Dummy |
.472 |
.333 |
2.011 |
1 |
.156 |
1.603 |
|
Provenance |
.023 |
.270 |
.007 |
1 |
.932 |
1.023 |
|
Self-informed ilness |
.057 |
.378 |
.023 |
1 |
.881 |
1.058 |
|
Children |
-.964 |
.716 |
1.814 |
1 |
.178 |
.381 |
|
Constant |
-9.484 |
2.007 |
22.332 |
1 |
.0001 |
.0001 |
Source: Students survey.
In our first model, with thirteen covariates introduced in the model (in addition to the constant), a single block and step, the three values match. The statistical significance (0,001) tells us that the model when built with these variables, allows a good fit, since the coefficients of the model are different from zero.
Table 9. Model coheficient Omnibus test
|
Chi-square |
gl |
Sig. |
|
|
Step |
595.035 |
13 |
.0001 |
|
Block |
595.035 |
13 |
.0001 |
|
Model |
595.035 |
13 |
.0001 |
Table 10. Model summary
|
Model summary |
||
|
Logarithm of likelihood -2 |
Cox y Snell R square |
Nagelkerke R square |
|
419, 165 |
.546 |
.738 |
Source: Students survey
The proportion of lifestyle variance of students explained by the variables that make up the model according to the Generalized Determination Coefficient Cox and Snell is 54.6% for the logistic regression model.
The variance explained with the correction of R squared Nalgelkerke is 73.8%, adjusting the variance of the model better so we will proceed to create a adjusted logistic regression model where that variable is not included.
Table 11. Fit model of logistic regression
|
Fit model of logistic regression |
||||||||
|
B |
Estandar error |
Wald |
gl |
Sig. |
OR |
Confidence interval |
||
|
Bottom |
Top |
|||||||
|
Nutrition |
2.380 |
.277 |
73.658 |
1 |
.000 |
10.803 |
6.274 |
18.602 |
|
Work out |
2.221 |
.407 |
29.829 |
1 |
.000 |
9.212 |
4.152 |
20.439 |
|
Health responsability |
4.551 |
1.120 |
16.498 |
1 |
.000 |
94.727 |
10.538 |
851.525 |
|
Stress management |
2.594 |
.350 |
54.906 |
1 |
.000 |
13.383 |
6.739 |
26.578 |
|
Interpersonal support |
2.603 |
.368 |
50.038 |
1 |
.000 |
13.502 |
6.565 |
27.773 |
|
Self up dating |
4.057 |
.723 |
31.455 |
1 |
.000 |
57.798 |
14.002 |
238.583 |
|
Constant |
-10.609 |
1.320 |
64.553 |
1 |
.000 |
.000 |
||
Source: Students survey.
As it can be seen in the table, the OR of the responsibility dimensions in health and self-updating maintain high values, this means that there is collinearity, so it is decided to create a third model omitting these variables.
It is important to clarify that the variables created from the instruments developed by Nola Pender and Rosenberg are correlated with each other, so it is not uncommon for the model to have evidence of collinearity. However, the model’s ability to predict is efficient, based on the findings in the probability summary tables, where each prediction matches the characteristics in the lifestyle dimensions each student possesses.
Table 12. Fit model of logistic regression.
|
Fit model of logistic regression |
||||||||
|
B |
Estandar error |
Wald |
gl |
Sig. |
OR |
Confidence interval |
||
|
Bottom |
Top |
|||||||
|
Nutrition |
2.558 |
.257 |
98.719 |
1 |
.000 |
12.911 |
7.795 |
21.385 |
|
Work out |
1.743 |
.315 |
30.572 |
1 |
.000 |
5.712 |
3.080 |
10.594 |
|
Stress management |
2.367 |
.297 |
63.420 |
1 |
.000 |
10.665 |
5.956 |
19.097 |
|
Interpersonal Support |
2.926 |
.316 |
85.543 |
1 |
.000 |
18.661 |
10.037 |
34.694 |
|
Constant |
-5.394 |
0.464 |
135.135 |
1 |
.000 |
.005 |
||
Source: Students survey.
Below is an explanation of the OR risk possibilities obtained in the logistic regression model.
1. Students who have inadequate nutrition have a 12.9 times increased risk of inadequate lifestyle compared to those with adequate nutrition.
2. Students who have an inadequate work out habit have a 5.7 times, increased risk of inadequate lifestyle, compared to those students who have an adequate exercise habit.
3. Students who have inadequate stress management have 10.6 times, increased risk of inadequate lifestyle, compared to those who properly manage stress.
4. Students who have inadequate interpersonal support have an 18.6 times increased risk of an inadequate lifestyle, compared to those who have an adequate lifestyle.
The resulting equation in our adjusted logistic regression model is as follows:
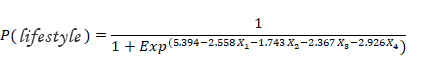
To explain the model equation we proceeded to make a probabilities table of five descriptive intervals that helps us summarize the results obtained from the equation of each student by means of the model, which generates as a result the following probabilities.
Table 13. Summary of the prediction capacity of the fit model.
|
Summary table of grouped probabilities model 3 |
||
|
Intervals |
Frequency |
Porcentage |
|
0,01 - 0,20 |
132 |
17.5% |
|
0,21 - 0,40 |
150 |
19.9% |
|
0,41 - 0,60 |
10 |
1.3% |
|
0,61 - 0,80 |
216 |
28.7% |
|
0,81 - 10 |
245 |
32.5% |
|
Total |
753 |
100.0% |
Source: Students survey.
First, the model is used to predict the response using the information in each row of the data file. If the predicted value is greater than the border, the student is considered an “inappropriate lifestyle”. The table shows the percentage of predicted observed data.
The first interval indicates that 17.5% of students surveyed (132) have a 0.01 to 0.20 chance of having an inadequate lifestyle.
The second interval indicates that 19.9% of students surveyed (150) have a 0, 21 - 0.40 chance of having an inadequate lifestyle.
The third interval indicates that 1.3% of students surveyed (10) have a 0.41 - 0.60 chance of having an inadequate lifestyle.
The fourth interval indicates that 28.7% of students surveyed (216) have a 0.61 - 0.80 chance of having an inadequate lifestyle.
The fifth interval indicates that 32.5% of students surveyed (245) have a 0.81 – 1 chance of having an inadequate lifestyle.
This is summarized in the graph below
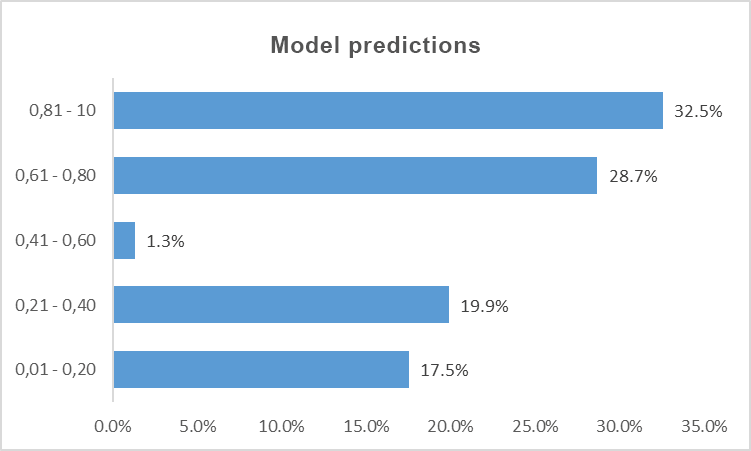
Graph 1. Model predicted probability. Source: Students survey.
Discussion
In the present work, first of its kind at the National Autonomous University of Nicaragua, Managua, a sample of 753 university students from 16 to 29 years of age entered in 2012 and those in the last year 2016 was analyzed. The results obtained in this project show that after bivariate and multivariate analyses have been applied with respect to the personal factors age, gender, origin, self-informed disease and parenting, it is concluded that they are variables that do not represent significantly in the Pearson Square Chi association test, so it can be said that the variable personal factors presented in the study are not dependent on the lifestyle of the students.
On the other hand, it is proven that the dimensions that make up the lifestyle can explain the lifestyle of RURD students.
Based on the revised literature for the elaboration of the project in terms of lifestyles, according to Nola Pender the health promoter lifestyle refers to the set of behavioral patterns or habits that are closely related to health in a broad sense, that is, to everything that provides well-being and development of the human person. People’s health is linked to lifestyle, because the health-promoting lifestyle seeks the well-being of the human being and unhealthy lifestyles are associated with risk factors that contribute to the presence of diseases. Therefore, with regarding to the above mentioned, within the nutrition dimension the lifestyle of students is inadequate in 54% of students not presenting many differences in relation to the year of admission to the university, this relates directly to the BMI found in students in study, and in women this was between 15.61 and 42.1 kg , with an average of 23.43 ± 4.09 DE so it can be inferred that 67.27% of BMI is grouped between 19.34 and 27.52 being overweight. In relation to the BMI of males under study, these were between 14.69 and 54.28 Kg, with an average of 23.74 ± 4.84 DE, so 68.27% of BMIs are grouped between 18.91 and 2 8.58 Kg considering grade 1 obesity. These results resemble studies conducted at the national level that demonstrate the prevalence of risk factors in RURD students, and workers, reporting that 11.17% were at normal weight, 59.88% increased risk of overweight (BMI 25 – 29.99) and obese (BMI 30 to 40).
In the work out dimension, the lifestyle is inadequate in students, both those who entered in 2012 and 2016, obtaining 56% and 58% respectively.
The female gender is between values 5 and 20 with an average of 9.46 ± 3.39 SD indicating that 68.27% of women are grouped between the values of 6.07 and 12.85 being the appropriate values between 14 and 20, males are among the minimum and maximum equal values of 5 and 20 with an average of 10.69 ± 3.48 DE , indicating that 68.27% of males are between values 7.21 and 14.17.
In this case the students surveyed are not developing fitness skills that contribute to overall health.
Responsibility for health implies an active sense of responsibility for one’s own well-being. This includes self-observation behaviors, informing and educating about health, exercising timely use of health services, and informed consumerism when requesting professional assistance, findings found in students were an inadequate health responsibility in both those admitted in 2012 and those in 2016, resulting in 59% and 61% failing to have their health responsibility.
Stress management refers to the set of responses to the stressful situation, which involve the identification and implementation of the psychological and physical resources executed to control or reduce tension effectively. For RURD students surveyed this lifestyle dimension is inadequate 54% (more than half) of students. Stress is a potential threat to the mental health and physical well-being of the subject and a risk factor for health problems such as headaches, back pain, cancer, heart disease and gastrointestinal disorders; reported diseases in some students in the compound.
As for the interpersonal support dimension was also found inadequate in the students surveyed, it is important to recognize that interpersonal relationships, social interaction and communication are fundamental to achieving a sense of intimacy; significant closeness involved in sharing and expressing thoughts and feelings.
Self-realization of students under study was inadequate in 26% of students 2012 and 28% of students 2016, this dimension focuses on the development of internal resources through growth, connection and development, providing an inner peace that opens up the possibility of creating new options to become something more, going beyond who we are, at the same time provides us with a sense of harmony, fullness and connection with the universe. All of this results in the maximisation of human well-being to achieve well-being.
A binary logistic regression model was applied to make the predictions, in which thirteen dichotomous variables that make up the study were first introduced; seven of them made up personal factors, and 6 of them made up of lifestyle. When running the program, the software provides the bus test, model summary and variables that make up the regression model. To explain the model, the P value of the Wald statistic was taken as a reference indicating whether the explanatory variables included in the model provide information to explain the model-dependent variable in our case the lifestyle.
The P value of the Wald statistic of the variable gender, age, provenance, self-informed disease, child tenure and BMI has an associated value greater than 0.05 therefore we say that the variables of personal factors does not provide information to the logistic regression model. It is therefore concluded that personal factors do not provide enough information to predict the lifestyle of RURD students.
A second model was run that included the variables that make up lifestyles (nutrition, exercise, stress management, health responsibility, interpersonal support and self-updating), finding that these variables are correlated with each other, so it is decided to adjust the model by omitting the variables responsibility in health and self-updating, this in order to reduce the effect of collinearity.
The results of the third fitted model indicate OR with lower values, but highly explanatory in relation to lifestyle. It can be concluded that the model created is efficient in predicting the lifestyle that each student possesses.
Conclusions
This study Healthy Lifestyles and their association with personal factors in Students was carried out in the Rubén Darío University Campus of UNAN-Managua. This is a pioneering study that brings to the baseline for the healthy university program.
Among the main findings of this study were found that the personal factors age, gender, body mass index, provenance and height of the students are not associated with the lifestyle of these; On the other hand, there is a strong association between the dimensions of nutrition, work out, responsibility in health, stress management, self-realization and student lifestyle. The conclusions according to the specific objectives are explained in more detail below:
1. The personal characteristics of the students of the Rubén Darío University Campus were obtained, the average age of the female sex is 19 years, the weight was 58.14 kg, the height of 1.58 m, and the BMI is 23.43 considered overweight. The male sex the average age was 20 years, the weight of 67.26 kg, the height of 1.69 m, the BMI is 23.74 considered obesity grade 1.
Most of the students correspond to the urban area. Half of the students in study do not have any kind of student scholarship. Most students do not report self-informed illness and have no children.
2. The lifestyle profile of students of both genders of the RURD is inadequate.
Chi square association tests indicate that personal factors age, gender, provenance, height, self-informed disease are not associated with students’ lifestyles.
There is a strong association between the dimensions of nutrition, exercise, responsibility in health, stress management, self-realization and the lifestyle of students in study.
The logistic regression model reflects that students who have inadequate nutrition, inadequate exercise habit and inadequate stress management are at greater risk of inadequate lifestyle than those who have adequate nutrition, exercise habit and stress management.
Thanks
I wish to express my appreciation to the UNAN – Managua National Autonomous University for all the support provided in the conduct of this study and in particular to the Investment Fund in Thesis Project for the financial support provided for the successful completion of the research thesis.
Works Cited
A López de Adres, Cabo Saenz , M., & carbajal Azcona , A. (2010). Evaluacion del estado nutricional de un grupo de estudiantes universitarios mediante parámetros dietéticos y de composición corporal. Madrid servicio de relaciones científicas.
Agudo, m. G. (2014). Adolescencia y sexualidad: Resolviendo el conflicto Natura-Cultura. Palencia: Universidad de Valladolid.
Alcaraz, F. G., & Alfaro Espin , A. (2001). sexualidad y Anticoncepciòn en Jòvenes Universitarios de Albacete. Revista de Enfermerìa.
Amaia, I. A., Hollos cillero, I., Dìaz Ereño, E., Astiazaran Jon, I., & Gil Goikouria, J. (2007). Alimentaciòn de Estudiantes Universitarios. UPV/EHU. EUde Enfrmerìa, s/n.
Apcho, M. V. (2010). Estilo de vida de los estudiantes de enfermeria, segun año de estudio de la universidad Nacional Mayor de San Marco. Lima- Perú.
Aracely, Á. G., Hernández Pozo, M. R., Jimenez Martínez, M., & Durán Díaz, Á. (2014). Estilos de Vida y Presencia de Síndrme Metabólico en estudiantes Universitarios. Diferecias por sexo. Revista de Psicología.
Ballester, A. C., & Breva Asensio, A. (Esta página se editó por última vez el 7 mar 2018 a las 23:06. de Esta página se editó por última vez el 7 mar 2018 a las 23:06. de 2018). LA PREDICCIÓN DE LA CONDUCTA A TRAVÉS DE LOS CONSTRUCTOS QUE INTEGRAN LA TEORÍA DE ACCIÓN PLANEADA. Revista Electrónica de motivación y emoción, volumen 4 N 7. https://es.wikipedia.org/wiki/Teor%C3%ADa_del_comportamiento_planeado
C., L. S. (2012). Los estilos de vida en salud: del individuo al contexto. Rev. Fac. Nac. Salud Pública, 95-101.
Cala, M. L. (2010). Estilos de Vida y Salud en Estudiantes de una Facultad de Psicología. Psicología desde el Caribe, 155-178.
Cala, M. L., & Castaño Castillòn, J. J. (2010). Estilos de vida y Salud en estudiantes de una facultad de psicologìa. Psicologìa desde el Caribe, 25.
Calidad de vida y Estilos de Vida Saludable en un grupo de estudiantesde pregrado de la ciudad de Lima. (2010). Pensamiento Psicológico, 17-38.
Chau, C., & Saravia, J. C. (2016). Conductas de Salud en Estudiantes Universitarios Limeños. Revista Iberoamericana de Diagnóstico y Evaluación, 90-103.
Corvalan, A. M. (2012). Estilos de vida y Jovenes Universitarios.
Costa, M., & López , E. (1996). Estilos de Vida y Promoción de la Salud. Madrid: Pirámide. Recuperado el 16 de Septiembre de 2015
Dayana, G. L., García Salamanca, G. P., Tapiero Paipa, Y. T., & Ramos C, D. M. (2012). Determinates de los Estilos de Vida y su Implicación en la Salud de Jóvenes universitarios. Hacia la Promoción de la Salud, 169-185.
E, B.-L. (s.f.).
Escudero, A. G., Muñoz Alférez, M. J., Planells del Pozo, E. M., & López Aliaga, I. (2015). La etapa Universitaria no favorece el estilo de vida saludable en las estudiantes granadinas. Nutrición Hospitalaria, 975-979.
Estilos de Vida de Estudiantes Universitarios admitidos al Pregrado de la Carrera de medicina. (2013). Revista Facultad de Medicina, 51-56.
Estilos de vida y Promoción de la Salud: material didáctico. (s.f.). http://grupo.us.es/estudiohbsc/images/pdf/formacion/tema4.pdf.
Ferrer, A. R., Cabrero García, J., Ferrer Cascales, R. I., & Martínez, M. R. (2001). La calidad de vida y el estado de salud de los estudiantes universitarios. Alicante: Biblioteca Virtual Miguel de Cervantes.
Ferrer, A. R., Cabrero García, J., Ferrer Cascales, R. I., & Martínez, M. R. (2001). La Calidad de vida y el estado de salud de los estudiantes Universitarios. España: Publicaciones de la Universidad de Alicante.
Fundación BBVA. (2007). Libro de la Salud del Hospital Clinic de Barcelona y de la Fundación BBVA. España: Editoreal Nerea SA.
García, V. E. (2013). Estilo de vida de los. Colombia : IEMP.
García, V. E., Salazar Arango, P. A., Docal Millán, M. C., Aya Gómez, V. L., & Ardila Chacón, M. M. (2014). Estilo de vida de los jóvenes y las necesidades de educación sexual. Universidad de la Sabana, Procuraduría General de la Nación.
García, V. E., Salazar Arango, P. A., Docal Millán, M. C., Aya Gómez, V. L., Ardila Chacón, M. M., & Rivera, R. (s.f.).
García, V. E., Salazar Arango, p. a., Docal Millán, M. d., Aya Gómez, V. L., Ardila Chacón, M. M., & Rivera, R. (2013). Estilo de vida de los jovenes y la necesidad de educacion sexual. colombia: Procuraduría General de la Nación.
García, V. E., Salazar Arango, P. A., Docal Millán, M. d., Aya Gómez, V. L., Ardila Chacón, M. M., & Reynaldo, R. (2013). Estilo de vida de los jovenes y su necesidad de educacion sexual. Colombia: IEMP.
Gòmez, E. L., Gòmez Hernàndez, H. L., Morales Rodrìguez Brendar, P. R., & Pèrez Ramos, M. (2009). Uso del AUDIT y el DAST-10 para la identificación de abuso de sustancias psicoactivas y alcohol en adolescentes. REVISTA COLOMBIANA DE PSICOLOGÍA, 9-17.
Grupousesestudiohbs. (jueves de Noviembre de 2018). Estilos de vida y Promoción de la Salud: material didáctico. Grupo.us.es/estudiohbsc/images/pdf/formacion/tema4.pdf: rupo.us.es/estudiohbsc/images/pdf/formacion/tema4.pdf
Junta de Anda Lucia. (2013). Diagnosis Tècnica de Alcala la Real Tomo III. Provincia de Jaèn .
La Prensa. (11 de Febrero de 2014). A propósito de la visita a la UNAN-Managua. La Prensa, pág. 11A.
Laguando, E., & Gómez Díaz, M. P. (2014). Estilos de Vida Saludable en Estudiantes de Enfermería en la Universidaf Cooperativa de Colombia . Revista Hacia la Promoción de la Salud, 68-83.
Lalama, M. R. (2010). Diagnostico de los estilos de vida de los estudiants de la escuela superior politècnica de Chimborazo. Ecuador. Retrieved on August 2016 from www.uaeh.edu.mx/adminyserv/dir_generales/serv...servuniversitario/.../iv.../36.pdf: www.uaeh.edu.mx
Managua, U. (8 de Mayo de 2015). Plan Estrategico Institucional. Plan Estrategico Institucional. Managua, Managua, Nicaragua: Unan Managua.
Managua, U. (Dirección). (2016). Video Institucional UNAN Managua [Película].
Medina, C. O., & Urra Medina, E. . (2007). autoeficacia y Conductas de salud. Ciencia y Enfermerìa XIII, 9-15.
N, A. (2013). Informe de Evaluaciòn Comedores UAM. Managua : Universidad Centroamericana.
OMS. (2014). ENT Perfil de Paises.
Organización Mundial de la Salud. (2014). ENT Perfiles de países. Nicaragua.
Organización Mundial de la Salud. (2014). Informe Sobre la Situación Mundial de las enfermedades no Transmisibles. OMS. Ginebra: WHO/. http://www.who.int/about/licensing/copyright-form/en/index.html.
Organización Mundial de la Salud. (2014). Organización Mundial de la Salud - ENT Perfiles de países. Nicaragua.
Pacheco, R. L., Santos Silva, D. A., Pinheiro Gordia, A., Bianchini de Quadros, T. M., & Petroski, E. L. (2014). Sociodemographic Determinants of University Students Lifestyles. Revista de Salud Pública, 382-393.
Paèz Cala, M. L. (2012). Universidades saludables: Los jòvenes y la Salud. Redalyc.org, 205-220.
Pan American Health Organization. (2010). Encuesta de Diabetes, Hipertensión y Factores de Riesgo de Enfermedades Crónicas. Iniciativa Centroamericana de Diabetes (CAMDI), Managua. Managua, Nicaragua: Biblioteca Sede OPS - Catalogación en la fuente.
Pilar, G. M. (2010). Calidad de Vida y estilo de Vida Saludable en un grupo de estudiantes de pregrado de la ciudad de Lima. Pensamiento Psicològico, 17-38.
Pinto, J. F. (2010). ANALISIS PSICOMETRICO DE LA ESCALA DE AUTOESTIMA DE ROSENBERG EN UNA MUESTRA DE ESTUDIANTES UNIVERSITARIOS. Revista electrónica de trabajo social.
Programa de Apoyo a Políticas de Bienestar Universitario. (2012). Manual de estilos de vida saludables. Argentina: Comisión Universidad del Comahue Saludable, Universidad Nacional del Comahue.
Pucheta, A. R. (2010). CONSUMO DE TABACO EN ESTUDIANTES DE UNA SECUNDARIA PÚBLICA DE COATZACOALCOS, VERACRUZ. Mexico: UNIVERSIDAD VERACRUZANA.
Quesada, R. P. (2004). Educacion para la Salud Reto de nuestro tiempo. Madrid España: Dìaz de Santo SA.
Quinto, D. S., & Quispe Ticona, I. L. (s.f.). RELACIÓN ENTRE ESTILO DE VIDA Y ESTRÉS LABORAL DEL PERSONAL DE ENFERMERIA. (uancv, Ed.) REVISTA, 12.
Roa, L. A., & Pescador Vargas , B. (2015). La salud del ser humano Y Su armonia con el ambiente. Revista Med, 111- 122.
Rodrigo, M. J., Marquez , M. L., Garcìa , M., Mendoza , R., Rubio, A., Martìnez , A., & Martìn, J. C. (2004). Relaciones padres-hijos y estilos de vida en la adolescenci. Psicothema, 203-210.
Rojas, A. (2013). Uso de drogas en estudiantes de las carreras de Medicina, Psicologia, Trabajo social, Enfermerìa Bioanalisis, y Anestesia. Managua.
Ruìz, A. A. (2009). Factores asociados a la iniciaciòn al consumo de tabaco en estudiantes adolescentes de Managua. Managua.
S, Â. C. (2012). Los estilos de vida en Salud del individuo al contexto. Facultad Nacional de Salud pública, 95-101.
Supo, J. (2013). Cómo validar un instrumento. Perù : Copyright.
T, S., & Arrivillaga Quintero, I. C. (2004). El Consumo de Alcohol y otras drogas, como parte de los estilos de vida de jóvenes Universitarios. Revista Colombiana de Psicología, 74-89.
Tapia, E. M., Muñoz Bravo, F. A., Oviedo Salazar, M. C., & Rosero Jiménez , Y. A. (2010). Promocion de estilos de vida Saludable en la Zona Urbana de la Cabecera de Mocao. Universidad Mariana.
Tomey, A. M., & Raile Allogood, M. (2000). Modelos y teorias en enfermeria. Greenville, North Carolina: Harcort.
Veny, M. B. (2011). ESTILOS DE VIDA Y SALUD Estudiantes Universitarios. España: Institut Universitari d’Investigació en Ciències de la Salut.
Veny, M. B. (2012). Estilos de vda y salud e estudiantes universitarios: la universidad entorno promotor de la salud. España: Universitat de les Illes Balears.
Veny, M. B. (2012). Estilos de Vida en Estudiantes Universitarios. Dialnet, 34-35.